# Analysis Page
In the Analysis Page, the user can see the KPIs for a specific period at a car brand-level as well as a dealership-level.
# Components
# Period selection
To switch the analysis’ period, the user has on the top-right a choice selection on different period-levels:

There is also one gray arrow in the right-end and left-end that allows the user to advance to the following period or to go back to the previous period.
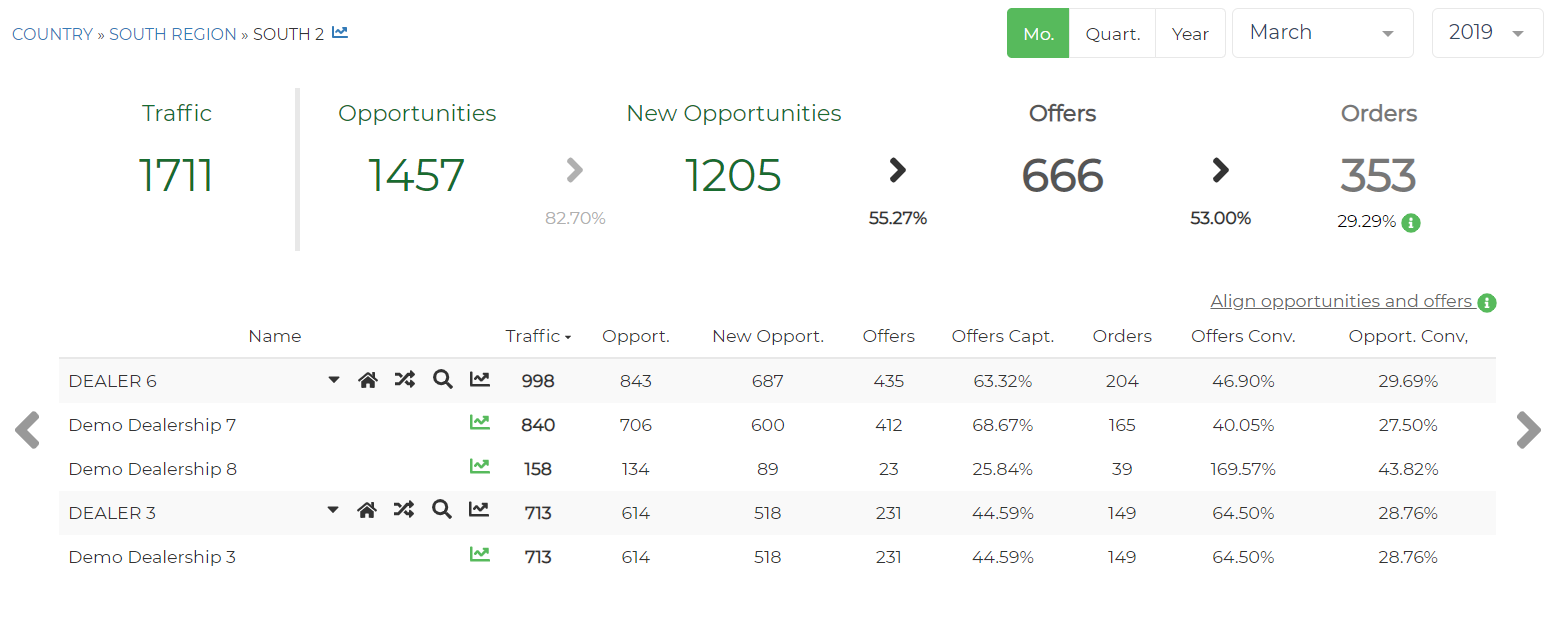
# Sales (Conversion) funel
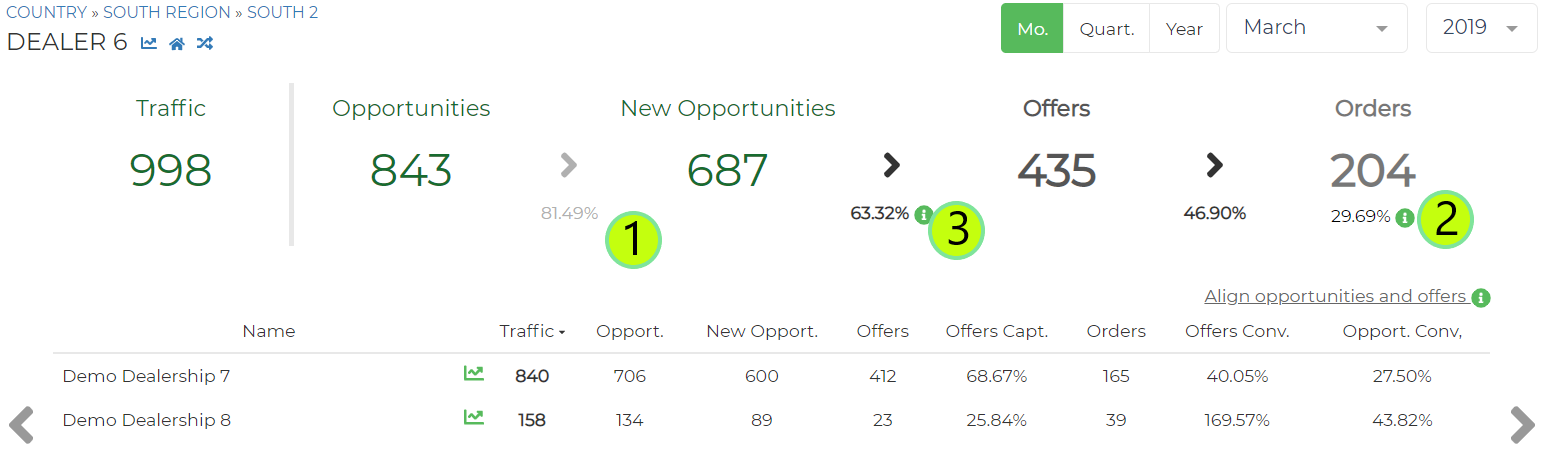
The above KPIs illustrate the Sales (Conversion) Funnel, from the walk-in detection to the Order, for the selected period.
The KPIs above are expressed in the car brand level. However, they do not represent the sum of the same KPIs at a dealership level as the same visitor might have been at different showrooms from the same car brand.
The conversion rate KPIs are expressed in percentage in between the absolute values (1). Additionally, for Orders KPI, the user can see the conversion rate from New Opportunities (2).
# Summary Table
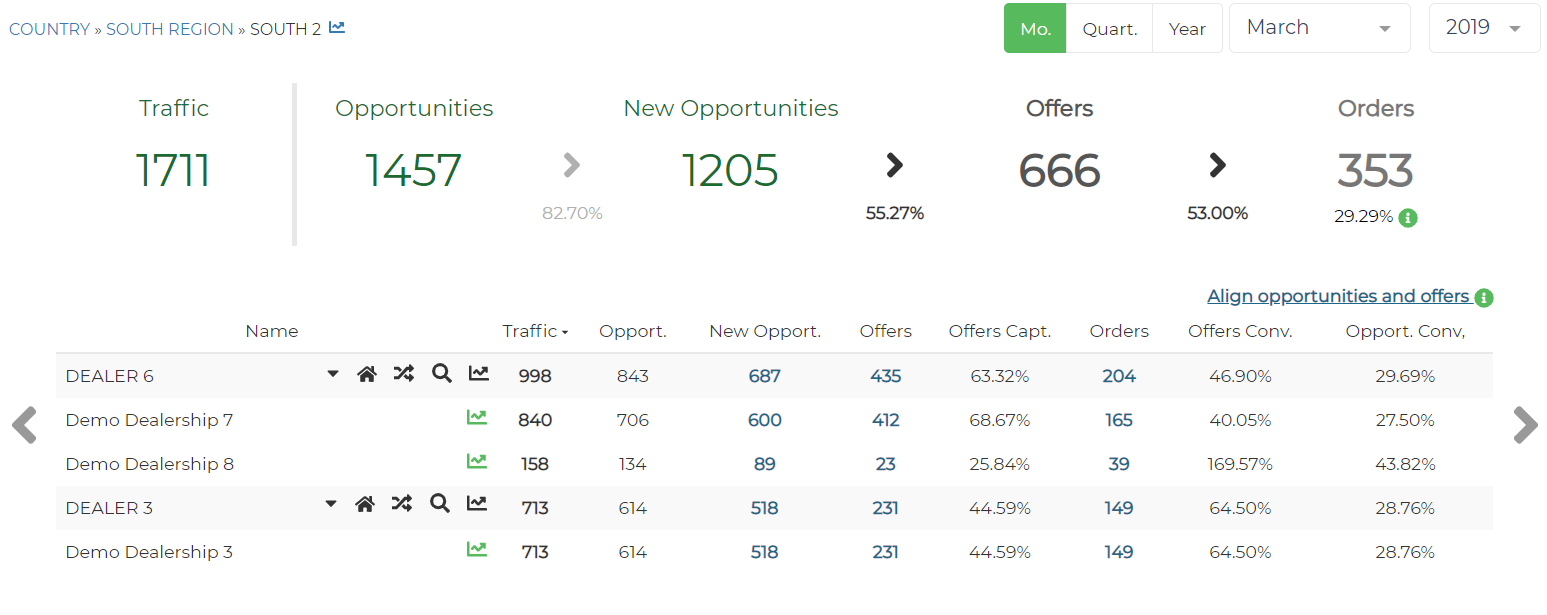
In the summary table, the user can visualize the different KPIs for the car brand’s dealerships in the selected period.
To avoid unintended fluctuations due to the lack of Offers input, in the conversion computations it is only considered the days in which there is valid data regarding offers and traffic.
The values considered for this computations can be seen when clicking over Align opportunities and offers. In Dealer level this would also shown the considered values in the KPI Funnel
# Dealer summary
In the summary table as zone level you can find its dealers, with a house-shaped button that brings you to the Dealer's Summary vision and another one displayed by two arrows that brings you to the Dealer's Migration vision

# Link to Tendency Page
In this screen, the user can access the tendency page by the following means:
- Dealership's Tendency: Click on the icon near the right side of the dealership's brand name.
- Car Brand's Aggregated Tendency: Click on Tendency at the menu's left side