# Tendency Page
# Components
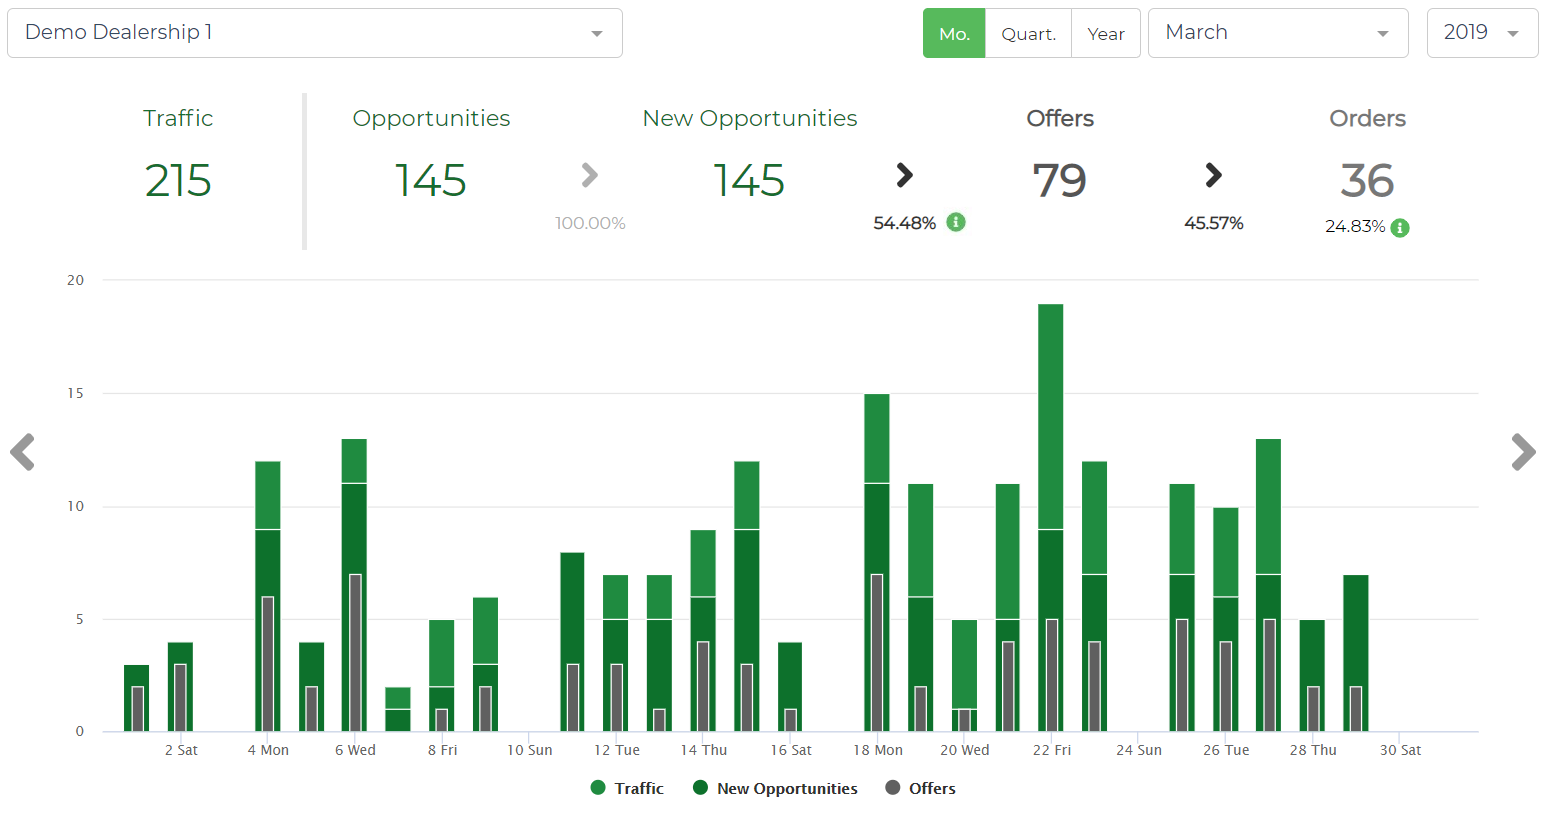
# Period Selection
To switch the analysis’ period, the user has on the top-right a choice selection on different period-levels:

There is also one gray arrow in the right-end and left-end that allows the user to advance to the following period or to go back to the previous period.
# Sales (Conversion) Funnel:
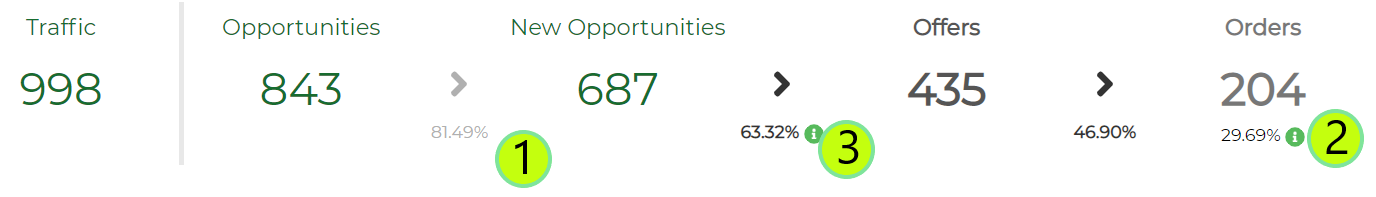
The above KPIs illustrate the Sales (Conversion) Funnel, from the walk-in detection to the Order, for the selected period.
The KPIs above are expressed in the car brand level. However, they do not represent the sum of the same KPIs at a dealership level as the same visitor might have been at different showrooms from the same car brand.
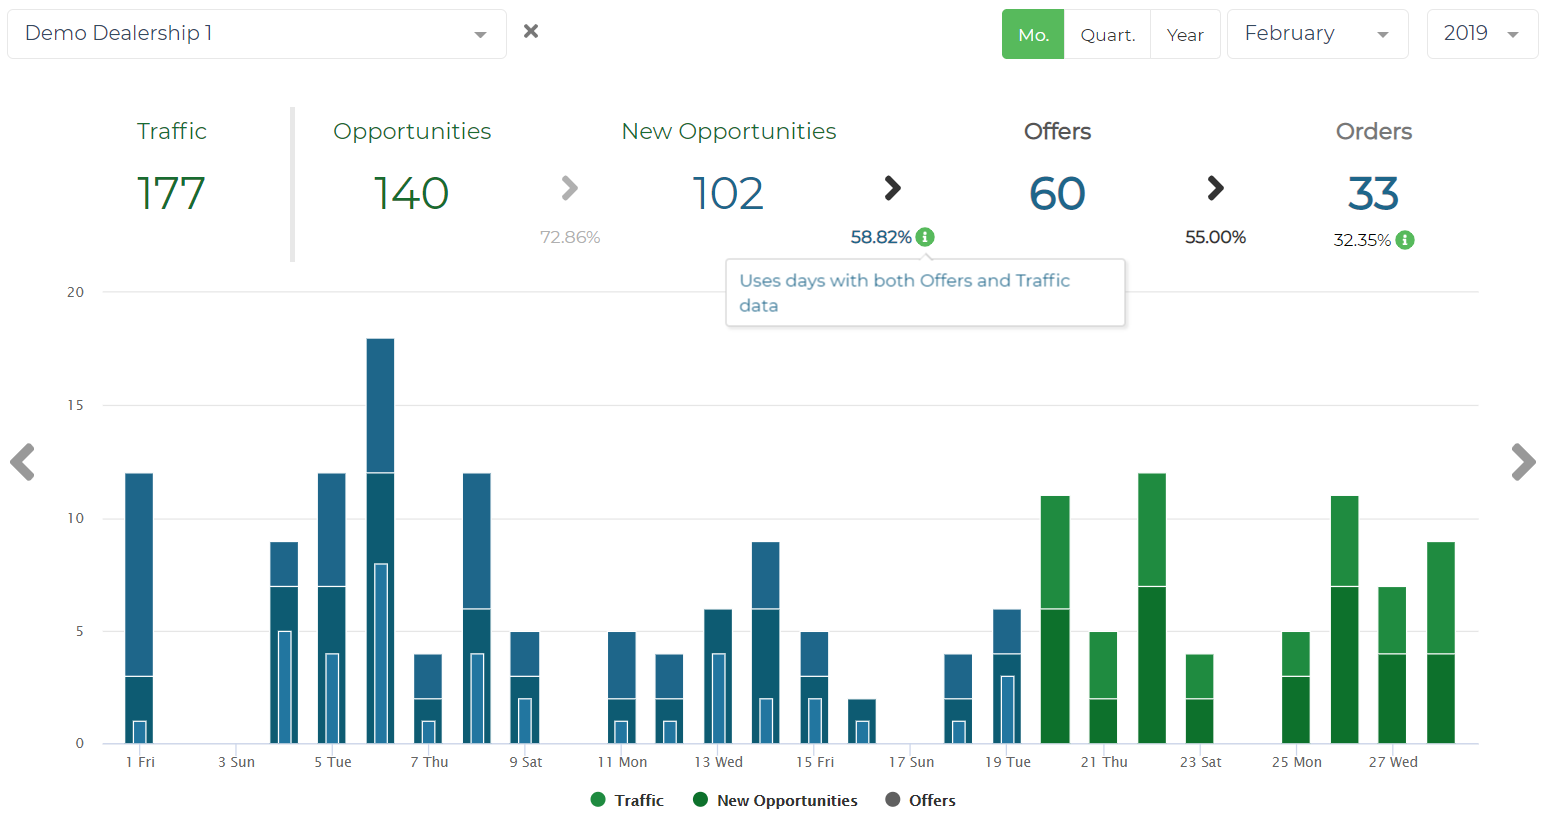
The conversion rate KPIs are expressed in percentage in between the absolute values (1). Additionally, for Orders KPI, the user can see the conversion rate from New Opportunities (2).
When in a Dealer or Dealership Tendency view, hovering over the green info icons (3) in the KPI funnel will display which KPI values were used to compute each of the capture and conversion rates
# Tendency
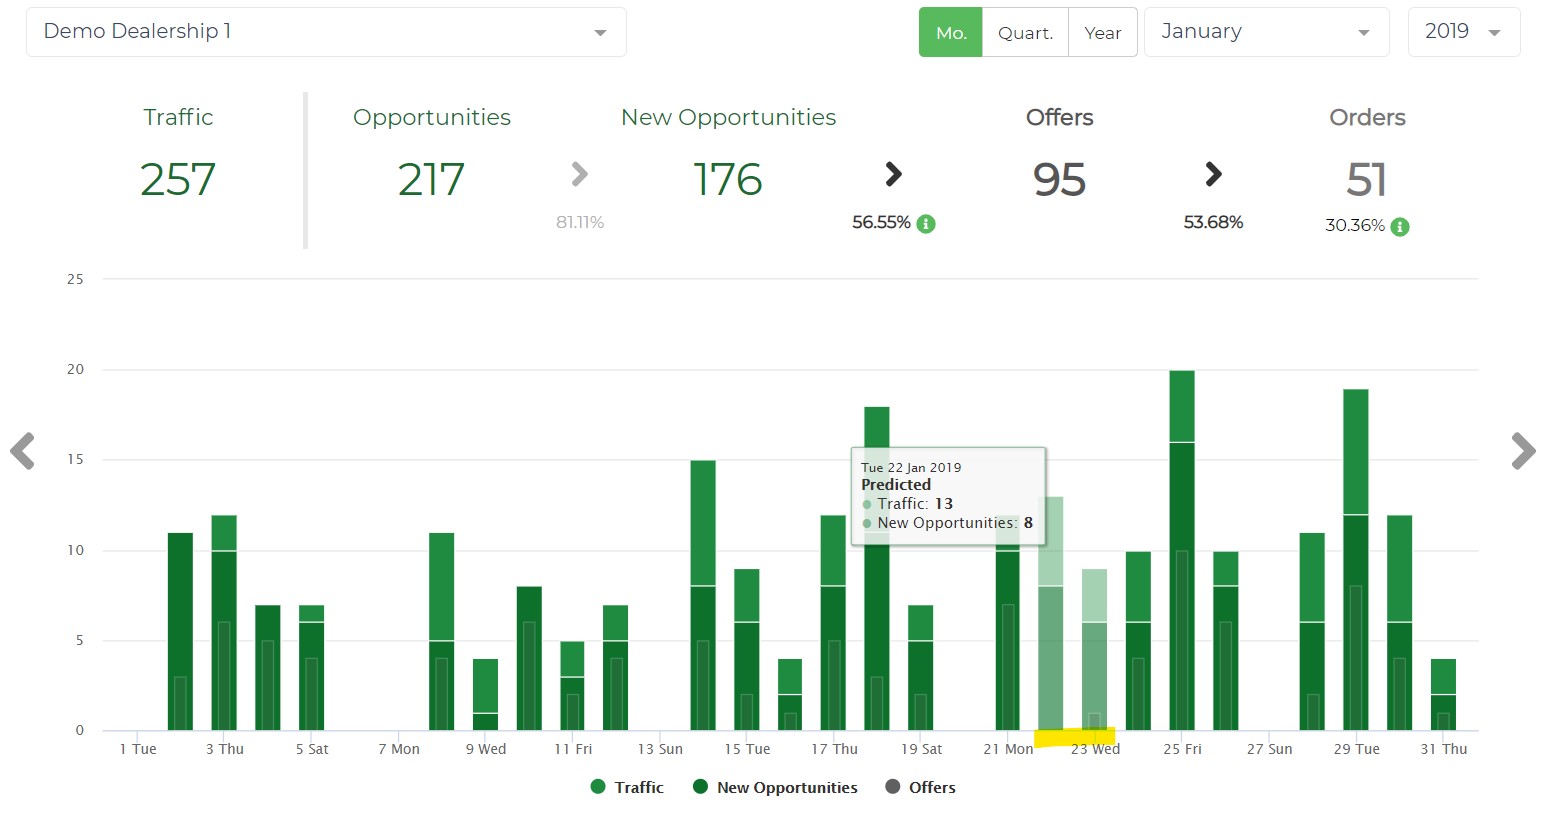
The tendency graphs illustrate, for the selected period, the evolution of different KPIs over time. Depending on the selected period, the displayed KPIs and the temporary aggregation might change.
# Monthly Tendency:
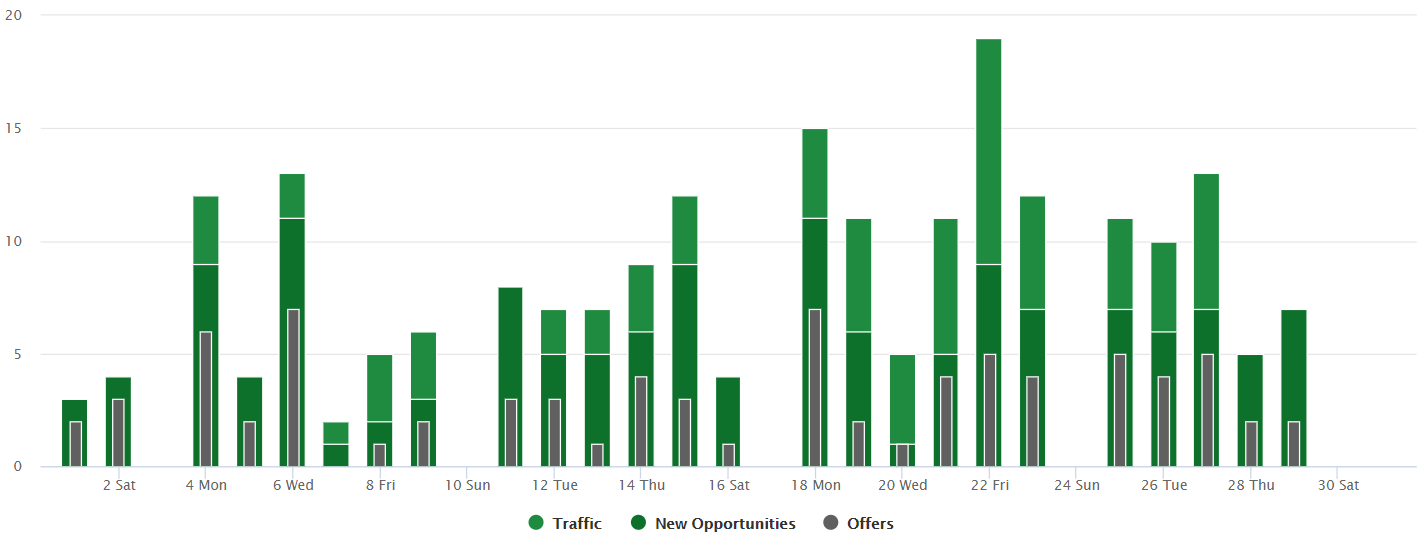
In the monthly tendency, the following KPIs are displayed in a daily level:
- Grouped Visits
- New opportunities
- Offers
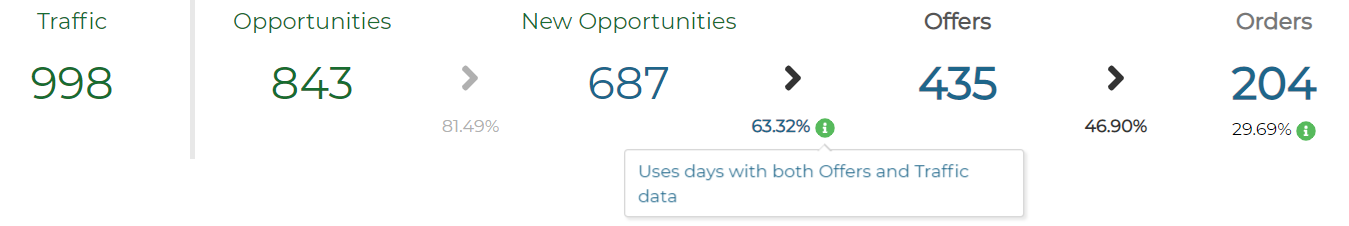
# Just in a Dealership's Monthly Trend
You will be able to see the Predicted days: Days for which we don't have enough data so we had to extrapolate data.
Also you'll be able to see the days that we've used to compute Conversions, that can be shown when hovering over the Offers Capture Rate KPI (the one between New Opportunities and Offers in the funnel).
These days are the ones with Traffic and Offers data.
# Quarterly Tendency:

In the quarterly tendency, the following KPIs are displayed in a weekly level:
- Grouped Visits
- New opportunities
- Offers
- Orders
- New opportunities to Offers conversion rate
In the bottom part of the graph, the quarter’s months are displayed. If you click on a specific month you will be quickly directed to the monthly view.
# Yearly Tendency:

In the yearly tendency, the following KPIs are displayed in a monthly level:
- Grouped Visits
- New opportunities
- Offers
- Orders
- New opportunities to Offers conversion rate
In the bottom part of the graph, the year’s quarters are displayed. If you click on a specific quarter you will be quickly directed to the quarterly view.