# Summary Page
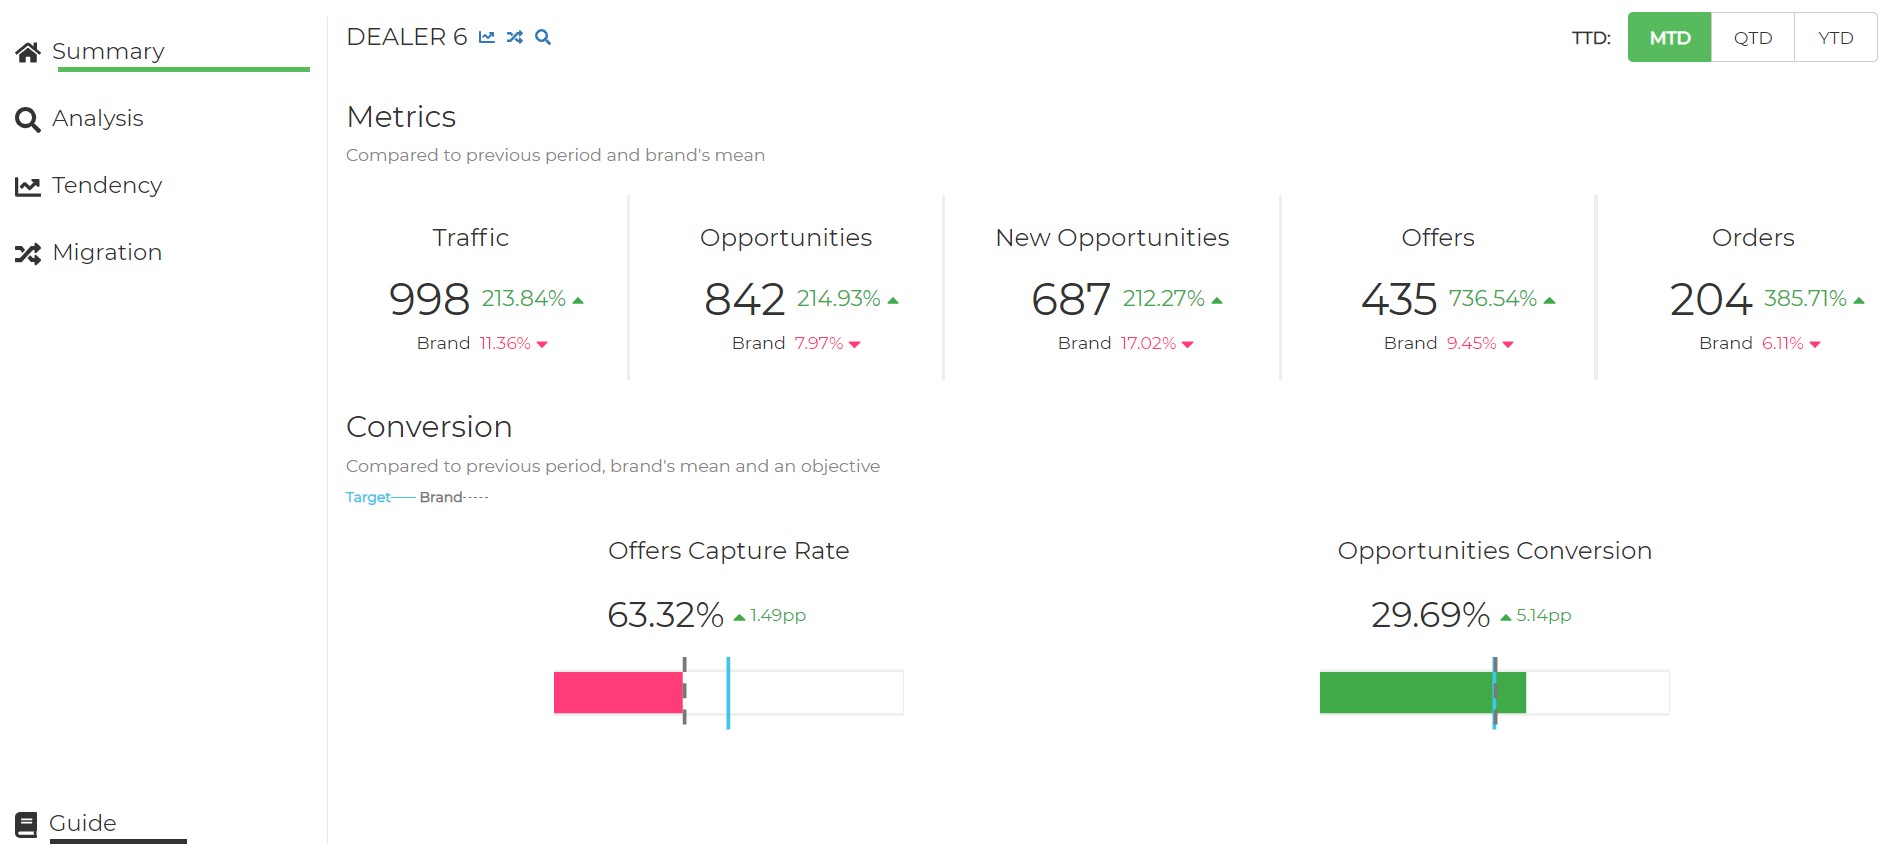
On this page, the dealer can analyze different KPIs during a specific period (Month to Date, Quarter to Date or Year to Date). These KPIs are compared with the KPIs for the previous period. The Dealer can also compare its own KPIs with the Brand’s mean KPIs.
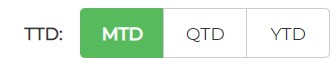
For example: If we click over MTD we'll see the data that corresponds to the period from the first day of the current month to yesterday, compared to the same period of the last year.
If there are NOT available data for accurate comparison with the previous period, it will be available only the KPIs corresponding to the current period.
# Components
# Browsing
By the Dealer's name we have three buttons, which are used to travel to Trend, Migrations and Analysis sections respectively
This predefined selection allows you to change the sample period
# Metrics
The first section contains Traffic, Offers and Orders KPIs
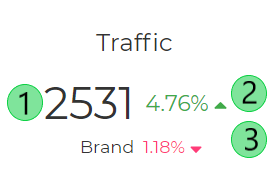
The KPIs above show data on:
- Visits in the Current Period
- Comparison with the previous period daily mean
- Comparison with the Brand’s daily mean in the current period
# Conversions
In this section, the dealers can visualize the Sales Conversion KPIs. In the representation above, the dealer can compare its Sales Conversion KPIs with the Brand’s mean KPIs and its target objective.

The KPIs above show data on:
- Conversion in the Current Period
- Comparison with the previous period performance
- Comparison with the Brand’s mean
- Target Objective
For the calculations above it is only considered the days in which the brand has added the number of offers and orders.