# Migration Page
On this page, it is possible to analyze the traffic of Sales Opportunities between Regions, Zones and Dealers, in order to understand where a sale opportunity started his journey, how it moved during the entire journey, and where the journey ended.
# Components
# Browsing
This predefined selection allows you to change the sample period

# Metrics
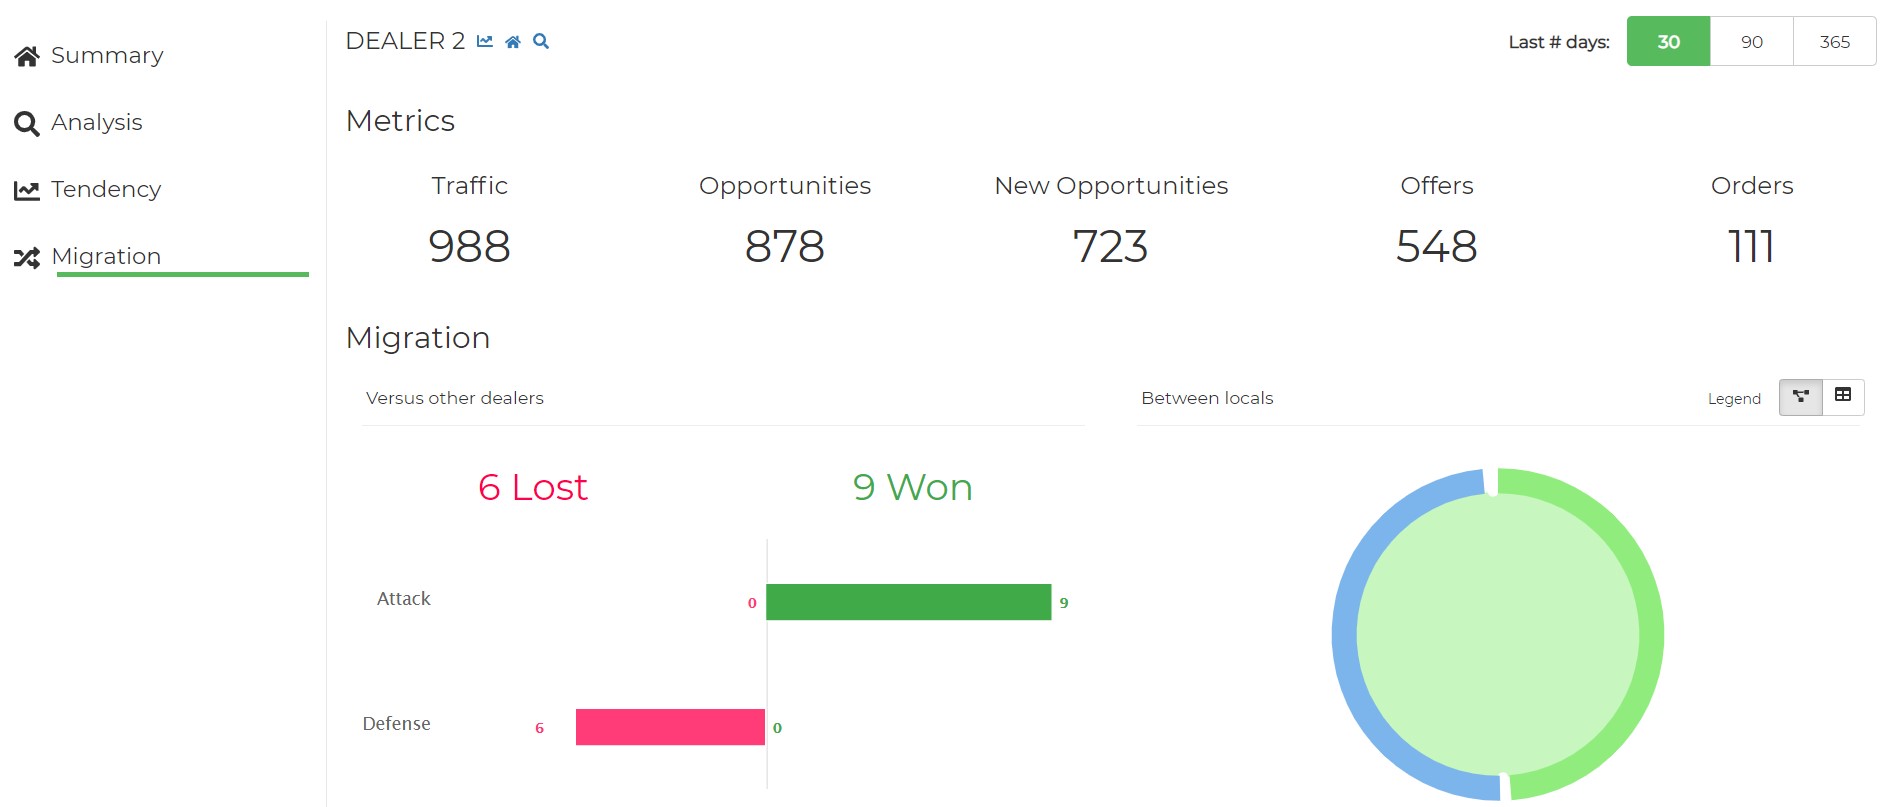
The first section contains Traffic, Offers and Orders KPIs
# Migration
The last section shows the migrations between Regions, Zones or Dealers.
In this chart we use the concept of Attack and Defense paired with red and green colours to show the events that affect every Region, Zone or Dealer in a positive or negative way:
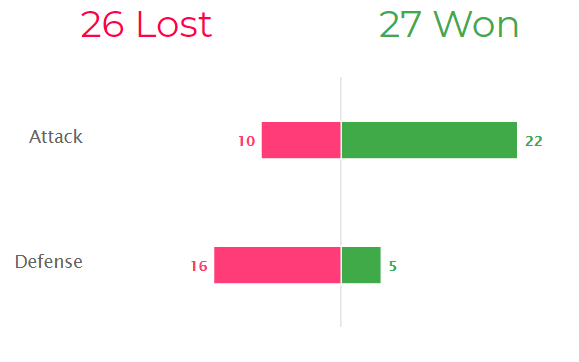
# The example above shows:
Let’s look at this example concerning one Dealer.
On the one hand, the 32 (10 + 22) attack migrations represent that the new sales opportunity has visited another Dealer before visiting this Dealer. Out of 32, 10 sales opportunities bounced to another Dealer (probably the first dealer they visited) after visiting the selected Dealer, thus the attack movement has not worked, and the selected Dealer lost this sales opportunity. The other 22 attack opportunities, the selected Dealer has won them as they did not visit another Dealer afterwards.
On the other hand, the 21 (16 + 5) defense migrations represent sales opportunities that started their buying journey in the selected Dealer and then visited another Dealer afterwards. Out of 21, 16 finished their visits in another Dealer and 5 bounced back to the selected Dealer, where they did their last visit. If in the next few days, any of the 16 lost opportunities bounce back to the selected Dealer, the opportunity will move from the left side (lost opportunities) of the graph to the right side (won/recovered) of the graph.
The same can happen between different Regions and Zones; the logic behind and the way it is presented in the dashboard will not change.
# Cannibalization
This section displays the internal migrations between Zones of one Region, Dealers of one Zone and Dealerships of one Dealer, using a Dependency Wheel
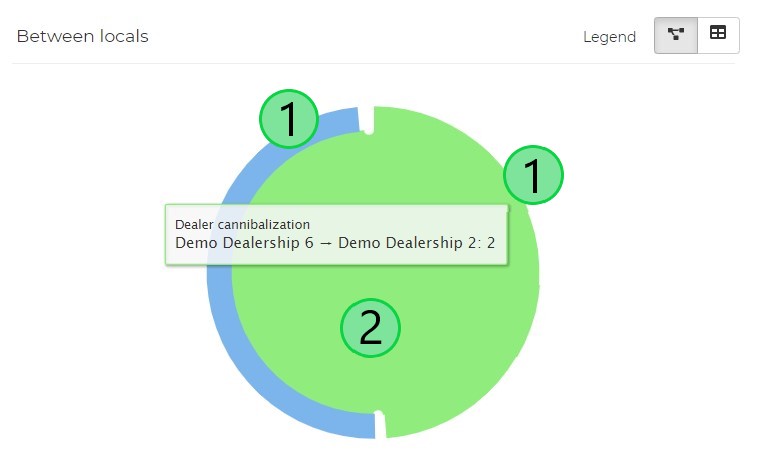
The example here is focused on Cannibalization between Delaerships of the same Dealer. Each dealership is represented by a given colored arc (1).
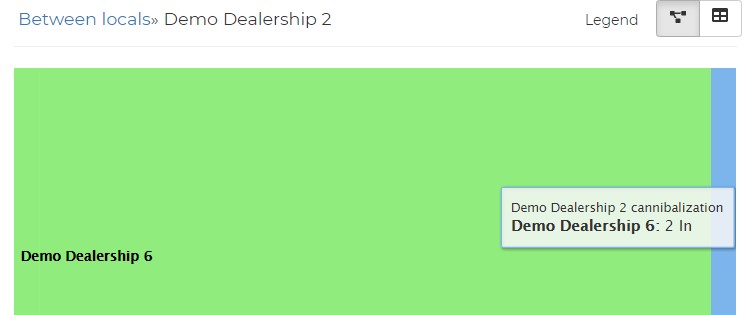
The migrations towards other dealerships is represented by a path between both dealerships (2). That path has the same color as the dealership which gives away the migrations.
Clicking over a dealership (1) transforms the Dependency Wheel into a Sankey Diagram, showing just the migrations that affect that dealership: