# Forecast Page
Forecast (pre-covid reference or generic future targets reference).
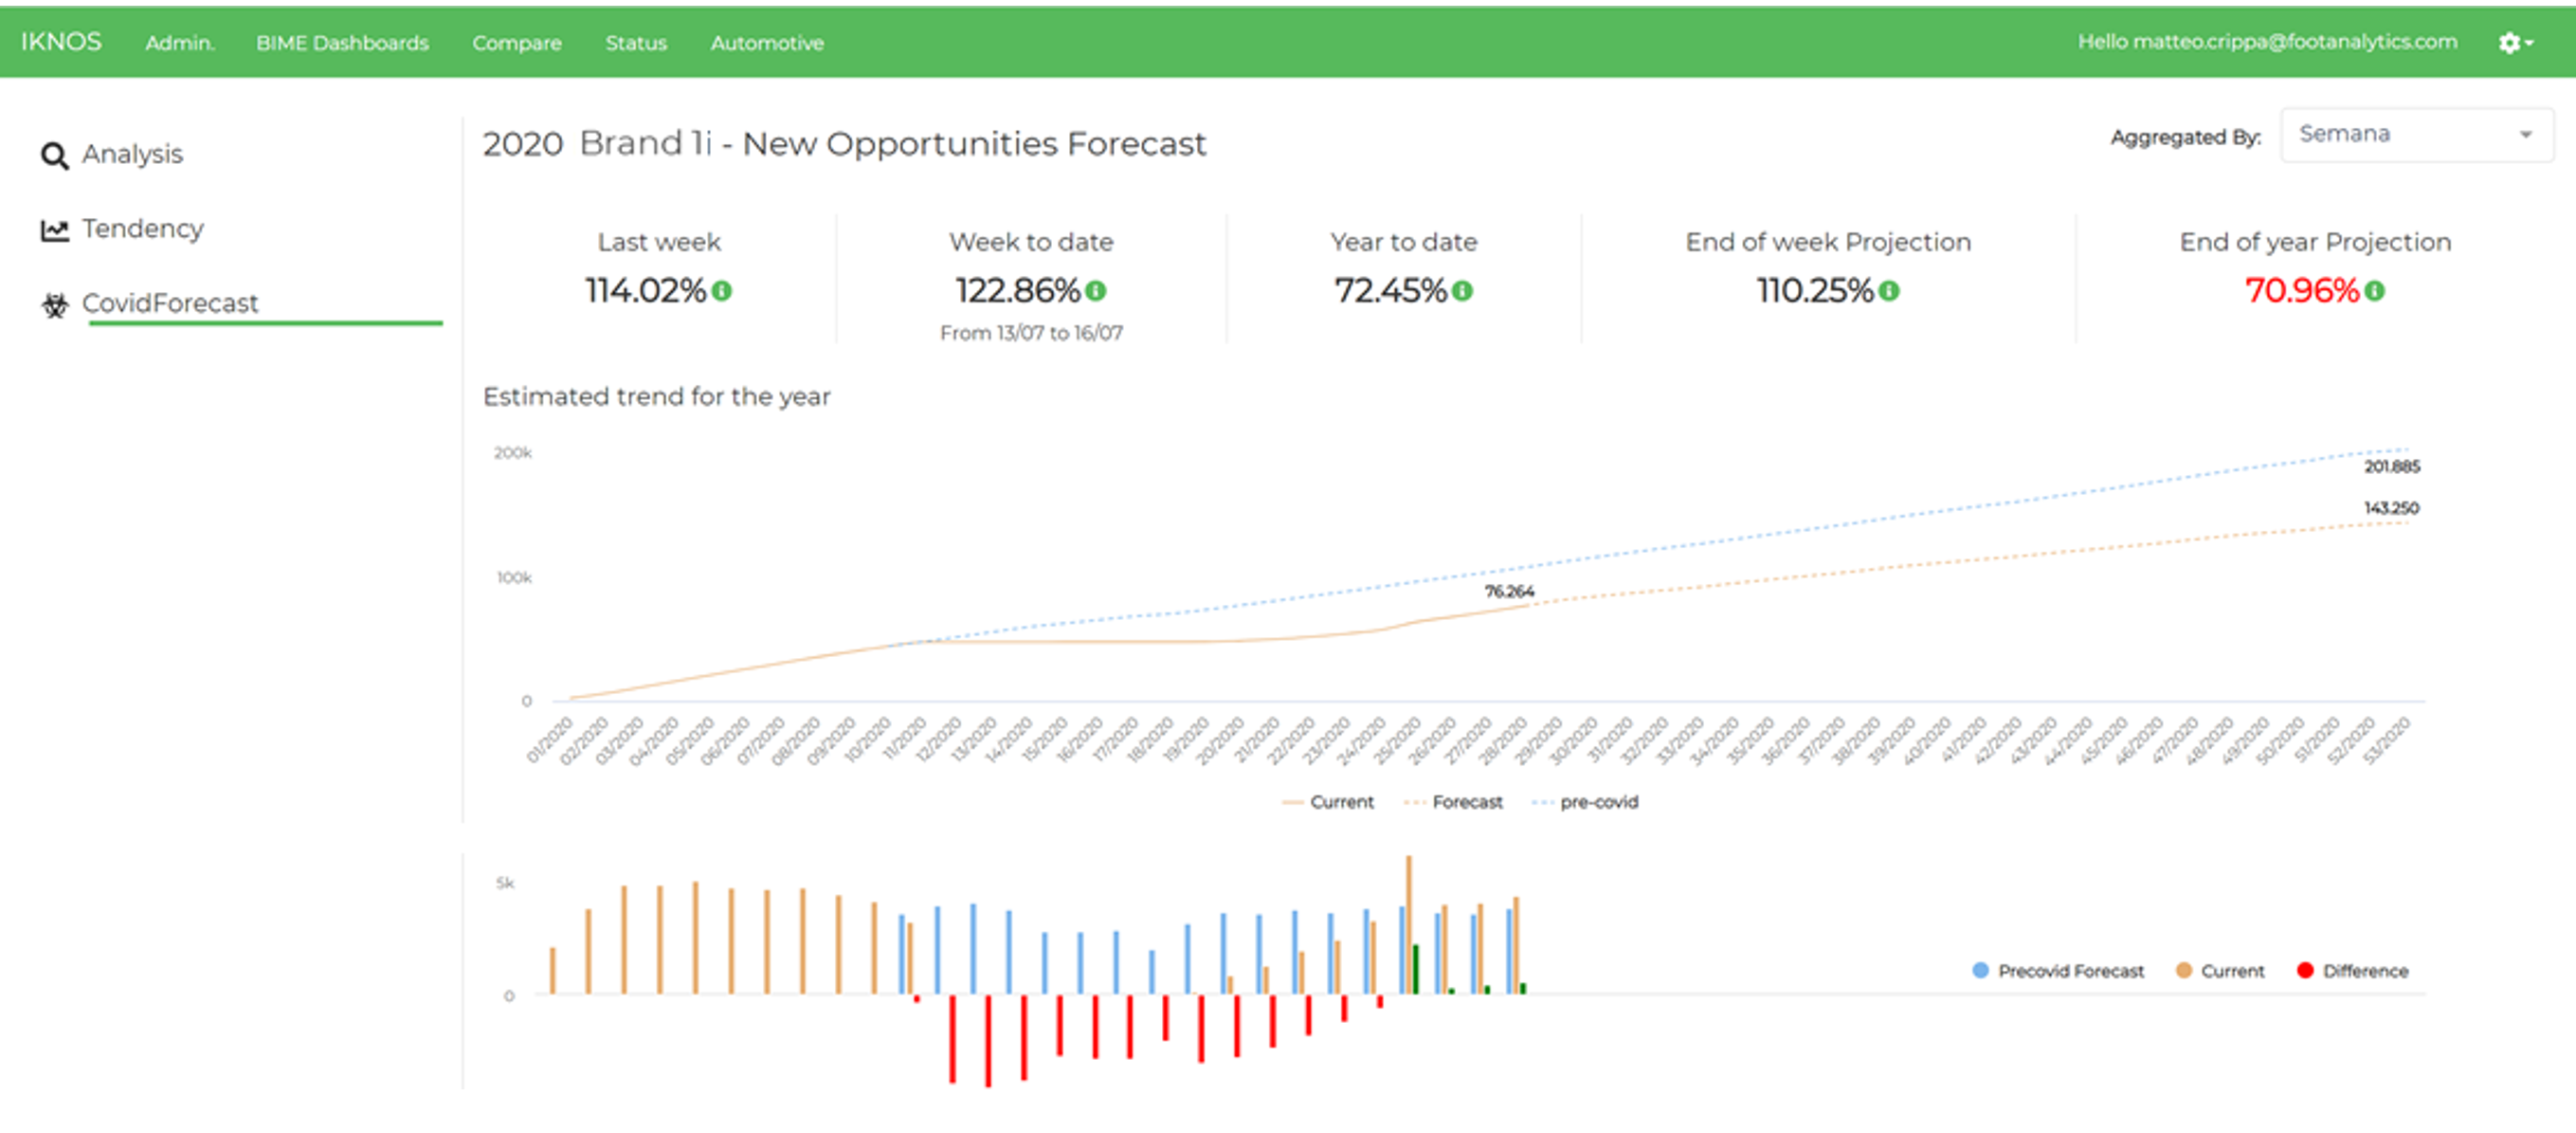
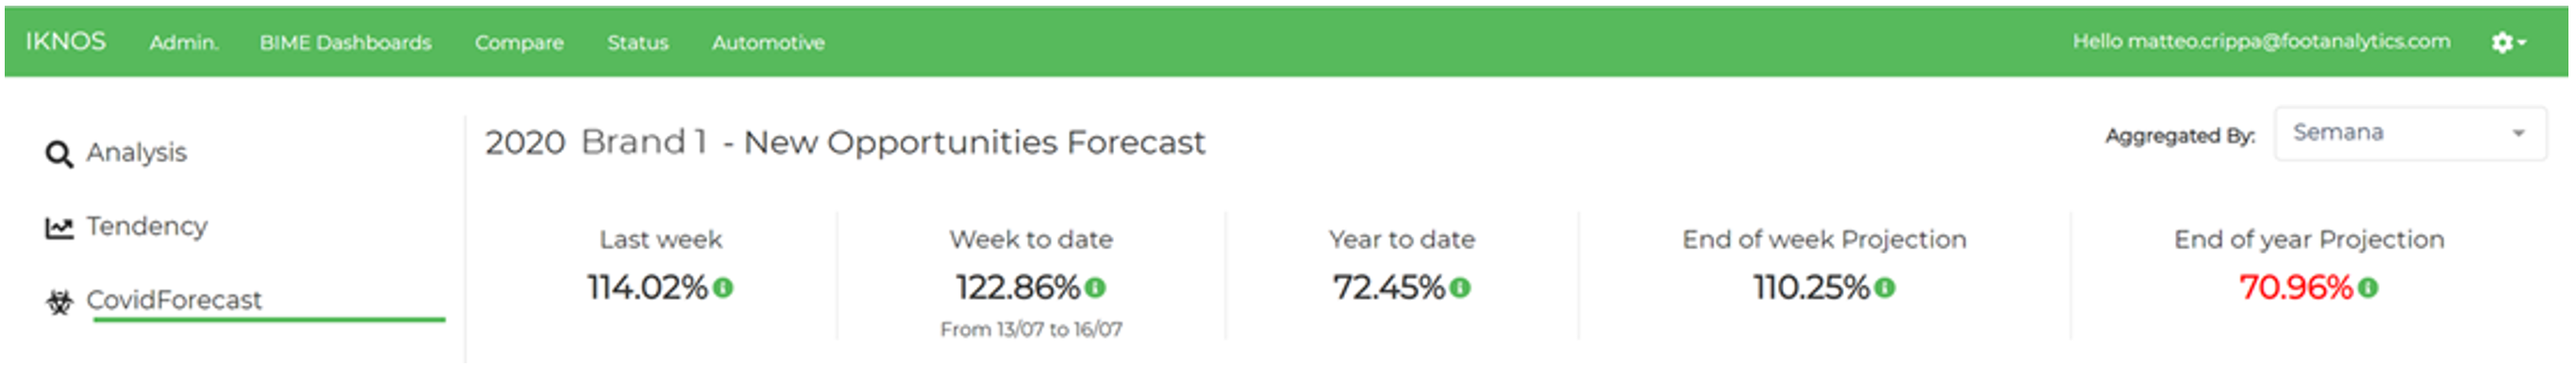
The Forecast Page is a benchmark tool to compare the current level of sales opportunities received by the brand with the amount of sales opportunities that were expected to be received from accurate predictions made in the past. The tool provides also a dynamic adaptation of the forecast on future sales opportunities based on the recent witnessed trends and market conditions.
The tool is particularly useful for two main reasons:
- It forces the top management to reason on the factors that are deviating the level of sales opportunities received from the one expected, whether internal or external.
- It allows the brand to be logistically and strategically ready for future volumes of sales opportunities.
A bar with the percentage variations in traffic of sales opportunities at different point in time is displayed at the top of the page. The bar is particularly useful as it gives a quick overview of the trend of sales opportunities’ size compared to the past and compared to future projections.
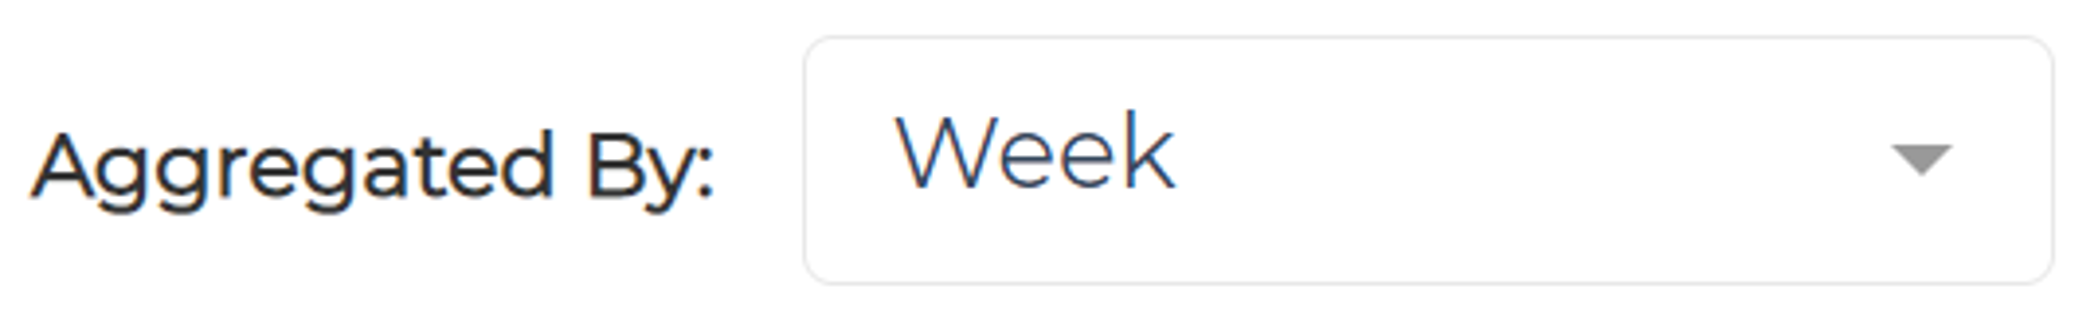
As always, data can be seen aggregated by Week or by Month bu just selecting the correct period in the drop down menu list.
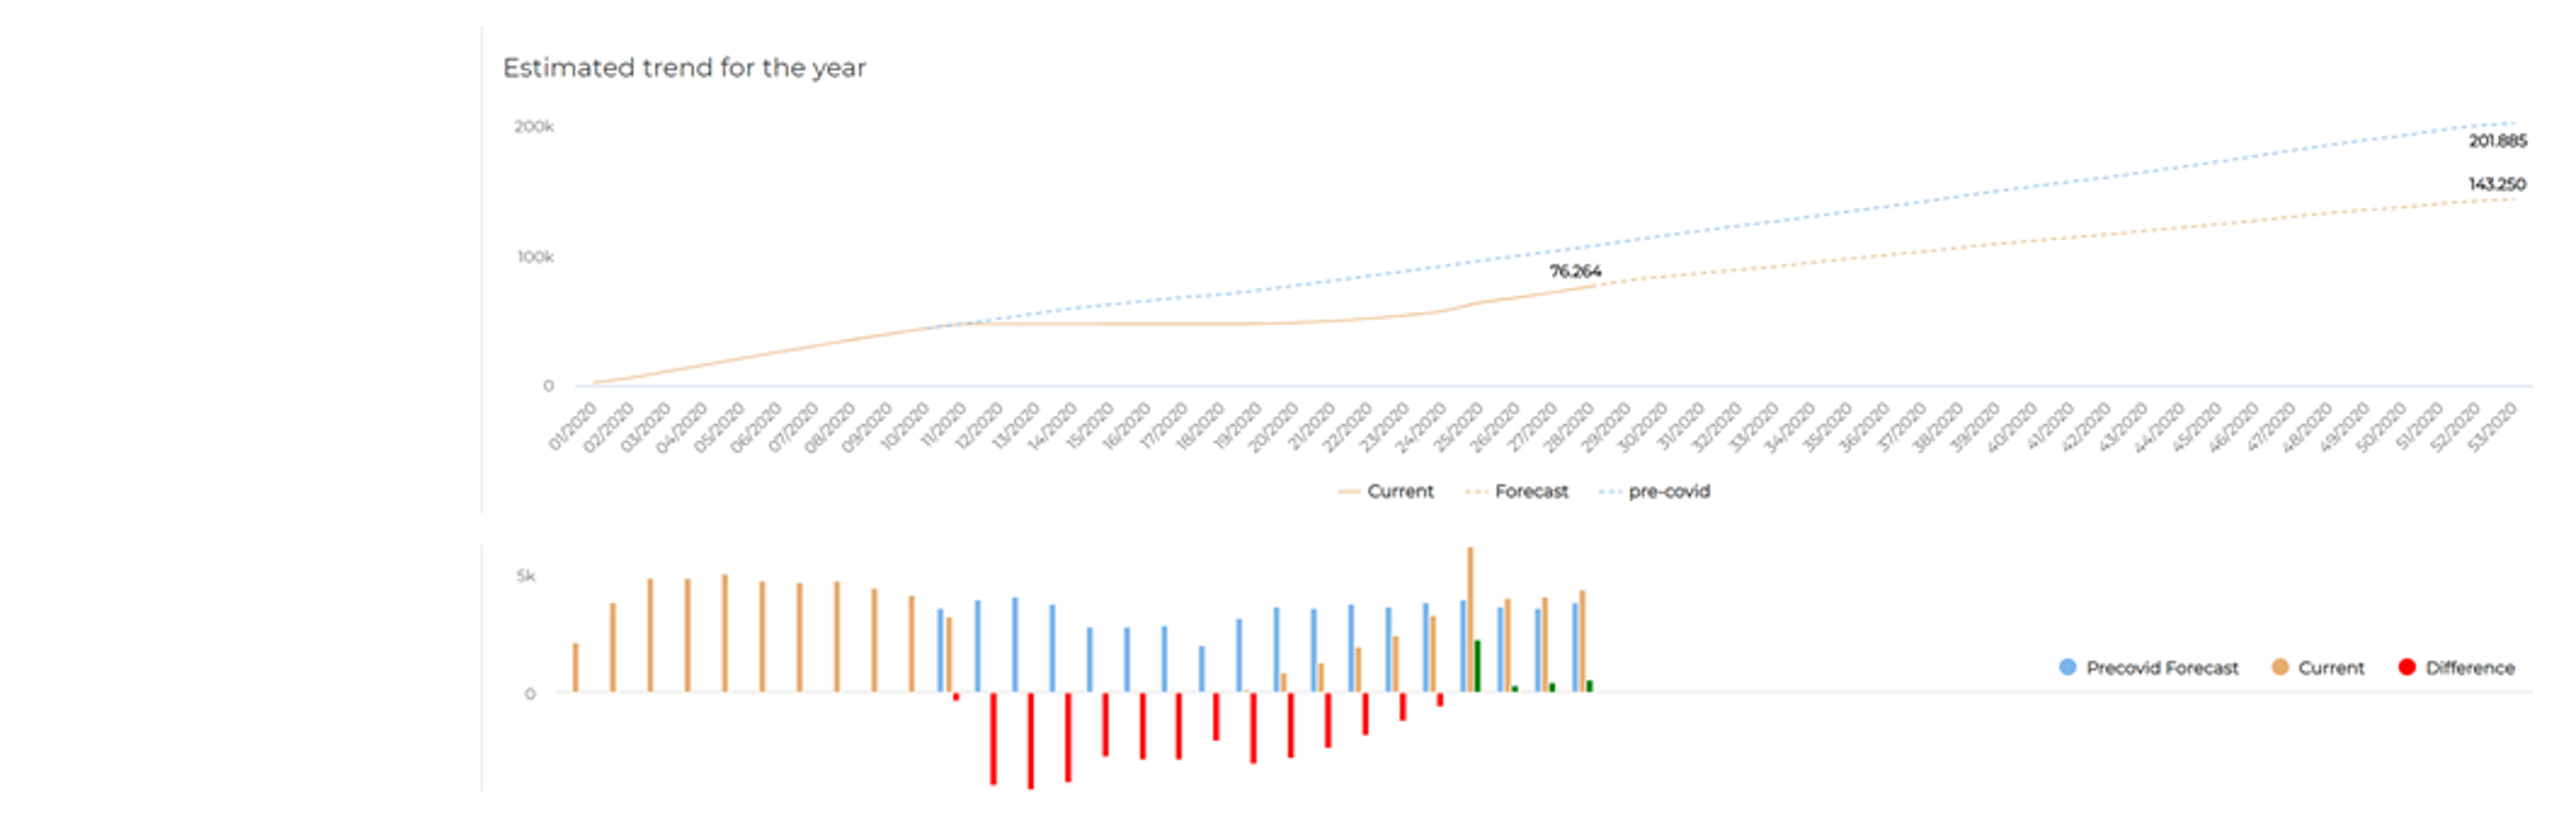
Just right below, you can see the funnel of sales opportunities represented with three lines:
- The blue dotted lines represent the projection made at the beginning of the year on the sales opportunities’ size to be received in the future
- The orange continuous line represents the number of sales opportunities that were actually received during as of that moment
- The orange dotted lines represent the projections of the number of future opportunities received at that time, which are based on current trends and market conditions.
As of now, the Forecast Page is only available at Brand level; the team is working to extend this dashboard to all the other visualization levels (Regions, Zones, Dealers, Dealerships)